ITR/IM Relational Analysis and Visualization Environment
(RAVE)
Roy Williams (PI), Julian
Bunn, Santiago Lombeyda
California Institute of Technology
1 Summary
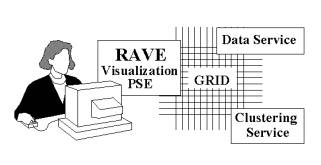
We propose to develop a visualization system for multivariate data that is a software component, coexisting with separate data-mining and data-storage services through the computational Grid. Our system, the Relational Analysis and Visualization Environment (RAVE), is itself modular, using a popular commercial problem-solving environment (NAG's Iris Explorer). RAVE communicates with mining and storage servers by any of a number of popular protocols, services that may be remote, may be implemented with computational Grid protocols.
We are not proposing a stand-alone system: we will make a tool according to the needs of its users. We believe that these needs are not for better visualization per se, but for two things: a simple, robust, and portable system that provides easy connectivity between data, visualization, and data-mining algorithms; and scalability with large amounts of data.
 The
objective of RAVE is to combine the flexibility and intuitive grasp of the
human visual system with powerful multidimensional data-mining software for
clustering, outlier detection, and association rules. RAVE will also connect in
the easiest way with data: databases, plain and structured files, and remote
data servers on the Internet, so that users need not do explicit data
reformatting. Having obtained the data from one source, computing and
data-mining services will be available on local or remote machines. The primary
intention is to provide an easy-to-use problem solving environment for
multivariate data which immediately provides the researcher with insight into
the structure of her data. It may be noted that a flexible visualization system
will also give the scientist valuable insight into the nature of the data-mining software.
The
objective of RAVE is to combine the flexibility and intuitive grasp of the
human visual system with powerful multidimensional data-mining software for
clustering, outlier detection, and association rules. RAVE will also connect in
the easiest way with data: databases, plain and structured files, and remote
data servers on the Internet, so that users need not do explicit data
reformatting. Having obtained the data from one source, computing and
data-mining services will be available on local or remote machines. The primary
intention is to provide an easy-to-use problem solving environment for
multivariate data which immediately provides the researcher with insight into
the structure of her data. It may be noted that a flexible visualization system
will also give the scientist valuable insight into the nature of the data-mining software.
We will construct our software by first establishing general, yet implementable, protocols, and a primitive system; we will then enjoin and encourage users from large scientific database projects (Ligo, Digital Sky, CMS/Atlas); then most of the work will be with domain-scientists and machine-learning specialists, extending the visualization environment and interchange protocols.
RAVE will be a problem-solving environment that will work with multivariate data: a table of mostly real numbers where the meaning of each column is carefully refined and retained by the system, and the rows of the table are labeled by a unique integer key (the ID). RAVE will provide various kinds of visualization services for these kinds of database tables, primarily through conversion to 3D geometry, as point clouds, parallel coordinates, etc.
The user may then select from the points (or record lines), either in the sense of taking a subset of the points or in the sense of labeling those points. When different columns are selected for the 3D projection, the labeling from another projection can be retained, so that the user can see if outliers and clusters in one space keep that characterization in another.
In addition to visualizing from columns of the original table, a user can also use modules from the RAVE toolbox to add columns to the table through computation. Such procedures might be as simple as scaling or rotation, a principle components transformation, or connecting to a classification service; when this occurs, the module adding the new columns is expected to be responsible for providing metadata: names and units for the new columns. In this way, meaningful column names will be available to downstream modules and axes will be properly labeled in the resulting display.
2 Grid-based Data and Computing Services
There is a large amount of scientific software bound up in forms that are difficult to use: as a program under the control of an individual with an idiosyncratic file format for both the input and output. In order for a data-owner to use the software, a personal relationship must be made. This is in contrast to advances in publication: in the past such a personal relationship was necessary before reading the preprint of another; the alternative was to wait for archival publication in a journal. Now, on the other hand, preprints can be made immediately available to anyone (if the author wishes) through the Web.
The computational Grid offers a similar paradigm today for computation. A service can be offered whereby data that is sent to the service can be mined for content in some way, and the results returned. The user of the service and the author of the software need not know each other, and arbitrary computing resources can be used in the computation. Of course, policies need to specify who may participate in such a scheme, and Grid services should provide strong authentication mechanisms to allow the restriction of such services. However, this proposal does not address restriction of service, only the mechanism by which such a service may be implemented.
We envision a client investigator, at a machine that can do 3D graphics with a visualization and problem-solving environment (RAVE), that is built on software such as NAG’s Iris Explorer. The client can select from a variety of modules that get or process data locally, or modules that get or process data at a remote location. For example, a multidimensional point-cloud may be sent to a clustering service, and it returns with each point “colored” according to the cluster to which it belongs. Or the client may request a dataset from a remote astronomical catalog, receiving it transparently.
2.1 Service Protocols
 One
of the major results from this work will be the protocols by which multidimensional
data can be exchanged between Grid-enabled scientific service providers. When
data is requested, the query may be in SQL or XQL, it may simply request a
given file name, or it may use a protocol such as DSTP (ref. [DSTP]). When a
clustering or outlier-detection service is requested, there may be additional
information (parameters such as how many clusters should be found, level of
hierarchy, and so on), and when data is received, it may include additional
information such as probabilities that each point lies in the given cluster.
One
of the major results from this work will be the protocols by which multidimensional
data can be exchanged between Grid-enabled scientific service providers. When
data is requested, the query may be in SQL or XQL, it may simply request a
given file name, or it may use a protocol such as DSTP (ref. [DSTP]). When a
clustering or outlier-detection service is requested, there may be additional
information (parameters such as how many clusters should be found, level of
hierarchy, and so on), and when data is received, it may include additional
information such as probabilities that each point lies in the given cluster.
Our main thrust will be to provide a framework by which these services can be implemented, including a fine visualization environment and layered support for many file formats and existing protocols. We hope to bring together application scientists with statisticians and data-miners, promoting a fruitful exchange between theory and experiment.
3
Applications
We envision RAVE to be beneficial across numerous fields of
scientific research. We have already been able to find interest in the RAVE
system from projects in Astronomy, Gravitational Physics, and High Energy
Physics. We describe some of these below.
3.1 Astronomy: NSF/NPACI Digital Sky project
Modern astronomy is not only concerned with studying singular objects in great detail: the new paradigm is to study populations of celestial sources, created from large-area sky surveys. Such a population is represented not by telescopic images of the sky, but by data tables such as those described above, where each row is a source of light (or infrared, X-ray, radio etc) from the sky, and the columns of the table represent position in the sky, magnitude in various spectral bands, the diffuseness of the source measured in various ways, any non-circularity of the source, and so on. Astronomers are interested in finding unusual types of object, for example distant quasars, brown dwarfs, loose clusters, or low-surface brightness galaxies.
Figure 1 shows an example of a figure from another system [Skyv] [Odew] which motivated this proposal, and which has generated significant progress in statistical astronomy. As all-sky surveys such as 2MASS, DPOSS, and Sloan come online, there is an urgent need in the stronomical community for tools for visualization and data-mining.
3.2 Gravitational physics: NSF LIGO project
LIGO (Laser Interferometric Gravitational Wave Observatory) is a large NSF-funded project to discover sources of Einsteinian gravitational waves, emitted perhaps by violent motion of compact objects such as black holes and neutron stars, or remnant gravitational radiation from the big bang. The raw data from the observatory is a collection of time-series at up to 16 kHz, and computers will apply pattern-matching algorithms to try to find the astrophysical signals. It is these that will form the input to RAVE: collections of candidate events, each with time, importance (signal-to-noise ratio), and the characteristics of the inferred event (e.g. black-hole mass, distance, etc.). Other collections of events come from the LIGO machine itself -- signals whose audio counterpart are clicks and scrapes and other noises that must be removed from the data stream. The classification of these events will be an important part of understanding the working of the observatory itself, as well as a route to finding the tiny number of astrophysically significant "real" events.
3.3 High-energy Physics
Data analysis in High Energy Physics (HEP) experiments is usually accomplished using software that operates by iterating over all available events and selecting those that match an event topology of interest. This selection is achieved by the application of “cuts” which are intended to maximize the signal to background ratio in candidate events that remain. As an example, we show a set of cuts in Table 1, taken from an analysis of B events at the SLAC “BaBar” experiment.
The cuts are expressed as a set of conditions on summary information[1] (often referred to as “Tag” data) available for each event. Typically, this summary information can be represented as a table of data where the rows correspond to individual events, and the columns label the salient features of the events. For example, the cut “Ntrack > 4” imposes the condition that there are more than four particle tracks in the event. The number of tracks is one of the columns in the aforementioned table. The cut “c2vertex < 4” selects events where the c2 of the fit to the vertex is less than 4. The c2 of this fit is another column in the table. In total, there might be around 100 columns, representing a 100-D space that contains all the events.
After all the cuts have been applied, the remaining set of events are used as a collection for detailed study, usually involving quite complex mathematical treatment. In most cases, the size of the collection numbers between thousands and hundreds of thousands of events. In other cases (especially for rare or anomalous events) the collections are much smaller, and each event in the collection may even be examined using an “event viewer” by a trained physicist. In either case, the results and conclusions from these detailed studies are usually presented in papers submitted to scientific journals.
 To explore the use of RAVE for particle
physics data, we will initially use simulated
data: Monte Carlo event data that has been generated using a known and
understood physics model. The simulated data have been pre-processed to account
for the detector acceptance and response, and massaged into a form that
emulates in all detail the data obtained from the real detector. By using simulated
data, we have a priori knowledge of the underlying physics behind the data, and
thus a good handle on what we should be able to observe in RAVE. Once there is
confidence with how this data sample is treated by the system, real data will
be used.
To explore the use of RAVE for particle
physics data, we will initially use simulated
data: Monte Carlo event data that has been generated using a known and
understood physics model. The simulated data have been pre-processed to account
for the detector acceptance and response, and massaged into a form that
emulates in all detail the data obtained from the real detector. By using simulated
data, we have a priori knowledge of the underlying physics behind the data, and
thus a good handle on what we should be able to observe in RAVE. Once there is
confidence with how this data sample is treated by the system, real data will
be used.
4 About the System
There are currently available several data visualization packages such as Xmdv
[Xmdv], Xgobi [Xgob], or IBM's Parallel Visual Explorer [Isen2]. These packages
offer the scientists analysis and visualization capabilities, but are limited
in their functionality, are inflexible, and do not interact well with the
outside world.
On the other hand, visualization systems such as AVS, IBM's Data Explorer, and NAG's Iris Explorer, give the end user an environment for easy and flexible data visualization prototyping through the use of a diverse collection of 'modules' (functional atoms). These systems are based on a directed acyclic graph (DAG) of software components -- modules -- with standard interfaces to other modules. It follows that they are extremely flexible, dynamic, and user friendly. However none of these systems do not offer a solid base of data analysis, mining, and clustering functionality capable of tackling complex tasks, while interfacing with outside applications and resources.
We propose to implement RAVE as a modular system which offers dynamic functionality to perform tasks in data clustering, data mining, and data visualization. Furthermore, we intend for such system to be capable of interfacing as a module itself with outside data sources, computational engines, and display systems.RAVE will be a Problem Solving Environment directed towards working scientists who wish to get insight quickly. RAVE will be constructed using the Iris Explorer visualization package by NAG, so that it can run on all popular workstations, including Windows, HP, Sun, and SGI. The user is intended to begin work at the desktop, generating the 3D graphics locally with OpenGL, or remotely, with transport through 3D X-windows. Iris Explorer can also run on very high-performance graphics systems such as the Immersadesk or Cave. Figure 2 shows an example RAVE session.
5 Data Model
 In
the RAVE system, the objects that will be passed between modules are relational
tables, meaning a combination of real-valued records and metadata.
Specifically, we intend to exchange a Table object, which defined as a
combination of a metadata record and a collection of data records. The metadata
defines the nature of the columns of the table, where each column is defined by
a short-name, with optional elements such as units, column type, min/max
values, and description. One column is the integer “ID” field, and another the
“Decision”, another integer; if these are not present in the input, they are
appropriately created. A data record is then a collection of real numbers, one
for each column in the metadata, together with two integers for the ID and
Decision numbers. Other information in the metadata record might include a
title and description of the table itself.
In
the RAVE system, the objects that will be passed between modules are relational
tables, meaning a combination of real-valued records and metadata.
Specifically, we intend to exchange a Table object, which defined as a
combination of a metadata record and a collection of data records. The metadata
defines the nature of the columns of the table, where each column is defined by
a short-name, with optional elements such as units, column type, min/max
values, and description. One column is the integer “ID” field, and another the
“Decision”, another integer; if these are not present in the input, they are
appropriately created. A data record is then a collection of real numbers, one
for each column in the metadata, together with two integers for the ID and
Decision numbers. Other information in the metadata record might include a
title and description of the table itself.
When a Table is modified or transformed in structure, it is expected that its metadata is also transformed appropriately. For example, if the module takes in a Table with Columns Mg, Mr, and Mi, (magnitudes of a star in three wavebands) and the module output is the differences of these, it could output the metadata stream to read Mg-Mr, Mr-Mi, and Mi-Mg.
5.1.1 Labels and Object ID
In addition to the real numbers that constitute the data, each record of a RAVE table has two further columns, both integers.
The ID number, which is read or created by the input module, is untouched by the RAVE system, only carried along with the record. In this way, a user can keep track of which record is which: after selecting the outliers that are worthy of further study, the user wants to be able to make a list of them, find them in the primary data, find them in other databases. The ID provides this immutable reference mechanism if necessary.
The other non-real number that is associated with each record we will call the Decision number. This integer is intended to be used as a label, so that different values could be rendered with different colors or symbols in the 3D scatterplot. The Decision attribute of each record could also be used as a bitfield, so that different parts of it could contain different kinds of labels.
5.2 Internal Modularity
Through the use of a visualization system, such as Iris Explorer, we are capable of isolating functionality as modules which may work independently or in conjunction with one another. The RAVE system will consist of a collection of modules, arranged as a directed acyclic graph (DAG), allowing users to:
· read/input data into the system
· read/input metadata into the system
· filter/alter/manipulate data and/or metadata (locally or remotely)
· visualize/interact with data
From a palette a user will be able to drag and drop the needed modules onto a work space, where the connections among the modules will be established. Modules will fire once input is selected or changed, creating a flow of data and metadata. The results of these 'maps' may be recorded as new data sets, or visualized using standard 2D and 3D display modules.
5.2.1 Data Flow
Data will flow through the modules as they are connected one to another. Each module has a set of input ports and output ports. Input ports of a module be hooked up to compatible output ports from another module. In the RAVE system, the user will have the option in each module to connect the metadata stream (port), the data stream (port), or both to achieve the desired results. This entails users actually using a pair of Explorer connections between modules, one for the metadata, one for the data.
Metadata will flow across the modules as a simple string based parameter. Data will be packaged as an Iris Explorer Lattice, allowing the user to take advantage of over 50 existing modules which read, write, manipulate, prove, and convert lattices into geometry.
5.3 External Modularity
We will strive to make RAVE a system that can connect effectively to any data source and any mining software. Connection to these systems will be either through a file format, through the standard database connectivity ODBC/JDBC, from web-based (HTTP) connections, or through other protocols. In the following descriptions of file formats, the term should be taken to refer to the object serialization or MIME-type used to transmit to and from remote services.
5.3.1 Simple File Format
The file format may be as simple as possible (including "comma-separated values"), and the metadata specification another comma-separated file of properties.
5.3.2 XML File Format
We will also support an XML specification for the metadata, derived from the Extensible Scientific Interchange Language [XSIL] co-authored by the PI. This specification allows the representation of more complex data objects than a single table: collections of tables, arrays, parameters, and other data objects. A natural module for the RAVE toolkit is an interface to allow data tables to be taken from an XSIL document that is acting as an "electronic notebook".
5.3.3
Data
Space Transfer Protocol
We also intend to support the Data Space Transfer Protocol (DSTP) from the National Center for Data Mining. This protocol provides a general mechanism for the distribution, inquiry, and retrieval of data columns for the purpose of a correlation study. The protocol is so designed that data columns from different servers can be joined based on specific Universal Correlation Keys (UCKs). The role of UCKs in DSTP can be considered analogous to that of a primary key attribute in a database. Because UCKs and primary keys are unique in DSTP and databases respectively, a join can be performed on either. The various commands and the associated responses in a DSTP server are similar to the ones in NNTP. The DSTP server uses a stream connection and SMTP-like commands and responses. It is designed to accept connections from hosts and to provide a simple interface to the data columns on the server. The server only serves as an interface between the programs and the data.
5.3.4 Database Connectivity with ODBC/JDBC
Using database technology (ODBC/JDBC) and web-servers (HTTP) for connecting to data sources allows commercial database technology into the picture, providing ways to index and cache large tables, ways to make such tables through joining other tables, and many other such data-intensive operations. Also available now is web-based access to the data, as well as paper reports -- perhaps of the outliers that have been found. The web technology allows us to deliver data (in the XML format), and to retrieve data directly from web-based services using XSIL that being established for the LIGO and Digital Sky archives.
5.3.5 Other File Formats
We will also support other file formats for both input and output, depending on demand from application scientists. We are considering HDF and netCDF, as well as Microsoft Excel.
5.4 Data Mining Software
In connecting to data-mining software, we shall begin by connecting RAVE to
· The LIGO data archive,
· The 2MASS and DPOSS all Sky surveys at Caltech,
· The Machine-Learning group at the Jet Propulsion Lab (Dr. Paul Stolorz),
· The Center for Image Processing and Integrated Computing at the University of California, Davis (Dr. David Rocke and Dr. Jian Dai).
We will negotiate the file formats for the data, and also some of the metadata transfer issues. Clustering software fits a model to data, and determines how each point of the input relates to that model. The software performs best when it can refine the model from a guess, perhaps the number of clusters that is expected, or which columns of the table might be more relevant than others. In a supervised classification, the user works closely with the machine to refine a model.
Inputs to the clustering code may include model information -- number of clusters, centers of clusters, directions of principle components, and so on; also some information about each column and whether it will play a part in the clustering. The output of the clustering run may produce a cluster label on each point -- presumably in the Decision attribute of the record -- or it may give a vector of probabilities that the point is in each of the clusters. The output table from the software must of course retain the ID attribute for each record, so that eventual report of the interesting records can be compared to the original data source.
Other XML formats are proposed for tables, including one from the astronomical community in Europe. We intend to ingest this directly into RAVE, using appropriate XML software to convert between formats. Another way to provide input would be a fill-in form at a web page that asks for metadata details and returns the equivalent XML description.
6 Visualization
Visualization enables scientists to see and explore their data, while gaining insight that would be difficult to infer from the numbers alone. RAVE will offer such capabilities by converting records into graphics. Traditionally we use one or two fields from the data and display the results as scatterplots or histograms. Other columns of the data table can be assigned to color attributes for each point in the visualization, either in a one-dimensional sense (a colormap), or with full two or three dimensional color. The color space need not be red, green, and blue, but we could express some kind of importance attribute of the record with brightness, and a periodic attribute (phase) using hue.
However there are further ways in which more fields may be displayed simultaneously. Three of the columns of the table can be used as a spatial location in the 3D visualization space or a 3D histogram, available through the clumping mechanism. We can also display all coordinates using parallel coordinates [Ise1], or newer variations of it such as hierarchical parallel coordinates [Fua].
Further attributes can be visualized as well through the use of glyphs. If points are rendered as spheres we can show importance or certainty with the size of its radius. For example, in analyzing candidate events from a pattern-matcher (e.g. LIGO events), the signal-to-noise ratio could be expressed by size, so that important events stand out well. If we were to use ellipsoids, we can then vary radii and orientation to express even further information (such as normalized tensor fields [Laid].)
6.1
Exploring 3D Visualization
With the popularity of 3D graphics hardware (from the influence of computer gaming), it is quite common to find most newer desktop machines which use specialized hardware to render 3D geometry. It is mainly due to this reason, that we believe that the average scientists may now easily take advantage of 3D graphics for data visualization. It is our intent to implement and study ways in which 3D visualization may be used for data analysis.
Such a proposition implies the ability to create 3D graphics geometry such as points, lines, faces, and texture-rendered faces (including volume rendering) for display of representations of the data itself or data internal relationships. This basic 3D graphic primitives can easily be expressed in standard platform-independent OpenGL or using a higher level OpenGL based language such as Open Inventor [OInv], which is fully supported by Iris Explorer. We will make such functionality available through modules which translate data into 3D scatter plots, parallel coordinates [Ise1], or uniform volume density fields, as well as developing and studying new techniques which take advantage of the available resources.
Studies such as the ones done by Ware and Frank [Ware] show than under certain circumstances additional 3D cues such as tracking of the user’s view point of origin as well as stereo displays dramatically increase understanding of what is being seen. In their particular study, using 'information nets', they considered the size of graph that a user can “understand”. There was an increase of a factor of 1.6 by using stereo, a factor of 2.2 by using head tracking, and a factor 3.0 by using both combined. Though these specific numbers are very closely related to the graphs used and the experiment's environment, we expect that the use of stereo and head-tracking will increase a users ability to understand and mine data as part of the RAVE system. It is our intention to test such hypothesis, and take advantage of it whenever possible. This task is facilitated by the ability of an Open Inventor (Iris Explorer) viewer to render in stereo (if hardware supports it,) as well as on-going efforts to link visualization systems to immersive environments [Boyd][Kuo].
Finally, due to modular environment and the base layers
(API's) offered by Iris Explorer, RAVE will constitute a system capable of
growing though module prototyping and development by the end users themselves.
That is accomplished through the used of the basic data structures offered
within Iris Explorer, extended to semantically encompass the data and metadata
stream flows, while being compliant with the visualization system and its
resources. Thus a user can filter and modify the input to create new outputs
(for instance create a data slice and then convert it into an elevation map) or
program new modules using Open Inventor (or Iris Explorer geometry API) to
create custom output geometry.
6.1.1 3D Scatter Plot
If a subset of the columns of the table (three of them) are nominated to represent the x, y and z coordinates, then this subset can be represented as a point cloud, like a 3D version of the traditional scatter plot. The user can select from the points, either in the sense of taking a subset of the points or in the sense of labeling those points. When different columns are selected for the 3D projection, the labeling from another projection can be retained, so that the user can see if outliers and clusters in one space keep that characterization in another.
Similar approaches have been utilized in systems like IVEE [Ahlb], MindSet [Beck], and Advizor2000 [Fyoc][VisI]. However these mostly exist within highly specialized software packages where the input and visualization are highly dependent on one another, and thus offer a very rigid environment. RAVE will offer same capabilities as the previously named packages within the flexible modular environment that a visual system such as Iris Explorer brings forth.
Subsequent work trying to understand the usability of such 3D scatter plots under immersive environments has been conducted [Eber]. We intend to continue such work by testing our system, and systematically and scientifically validating or refuting then assumptions that 3D scatter plots within and outside immersive environments offer considerable advantages over 2D visualizations.
6.1.2 Parallel Coordinates
Just a decade ago, Alfredo Isenberg [Ise1] proposed the use of parallel lines to represent the normalized ranges of different fields in a database, while representing a record as a line which traveled across these fields. This technique was baptized “parallel coordinates”. The advantage of this technique is that it allows simultaneous viewing of all fields, with the only limit being the screen size, while spotting relationships between data is as simple as seeing patterns (diagonal or parallel) in the lines between two fields. However problems arose due to clutter: too many lines. Since, there has been ongoing work to improve [Fuo][Ins3][Ward] this graphic technique by allowing dynamic zooming of field ranges, and by using transparency to fade less relevant records.
It is our belief that there is further potential in this technique. Easy creation and manipulation of color maps (which transparency mapping) within Iris Explorer is one of the ways in which the creation of parallel coordinates may become more usable. Equally the ability to pick records to hide/view, to select and move fields (parallel coordinate), can increase the value of this kind of depiction.
Similarly through the use of the standard OpenGL (Open Inventor) renderer module, we can have parallel coordinates render within a 3D environment. A simple modification can make the parallel coordinates be arranged in a circular pattern or radially from a sphere. We will allow the user to arrange the coordinates on regular or subjective grids where connections may be made from one coordinate to 1, 2, or more coordinates. The patterns than may be seen form this scheme will be part of our research, but it also may be used to visually cluster highly correlated fields, where they may be physically merged through simple drag and drop operations.
Finally we intend to study ways of using animations of field
ordering, positioning, and coloring in parallel coordinates for fast data
glancing. We envision allowing users to run animations in which the coloring
lookup changes across time from field to field, time in which the user might be
able to glimpse into particular settings under which she may discover new
clustering or data relationships. In the same way a user may play animations of
different order permutations of ordering of the data fields, time in which the
user hopefully will see one or several particular cases under which insight
into the data is gained.
6.2 Interactivity: Selecting and Labeling
One of the key attributes of a successful visualization system is the giving the ability to interact and query that which she is seeing. This can be done in terms of manipulating the view (zoom, pan, rotate) or in terms selecting some element of the visualization and having something happen from it, or having it removed, or have it change in color or glyph.
6.2.1 Scene Manipulation
The first, scene manipulation, is a trivial task under 2D, which is commonly done with scrollbars or simple window resizing. Under 3D, it embodies one of the most important cues into allowing the user to understand depth of the scenes being examined. In fact it is believed to be just as effective as view point tracking (i.e. head-tracking) [Ware]. Implementing such means having the system consistently translate user actions as corresponding changes in the view frustum. Open Inventor, and hence Iris Explorer, offer such a basic scene viewer which includes the basic capabilities, with the work being completely transparent to the user/developer. Not only basic actions (rotation, zooming, and panning) are offered, but also more complicated including changing projection mode from perspective to orthogonal, viewing as faces or as wireframe, or viewing in plain 3D or viewing in stereo.
6.2.2 Data/Visualization Manipulation, Labeling, and Probing
This second area of interest, data manipulation and probing, is fundamental to ‘visual’ data mining. For instance, in the case of scatter plots, we will implement a picking capability where a user can select points individually or in groups. Such selections may be used for labeling points, which will be implement through the use of Decision field, which in turn could change the color or other rendering attributes. Picked points could also be removed from the visualization, or perhaps all those not picked would be removed. Once points have been labeled in this way, the space projection can be changed, but with the original labeling retained. Labeling need not be done by a human, but it may be done with an Explorer module from the RAVE toolbox, or by an external classification service.
Software such as Advizor2000 offer similar selection techniques on 2D graphs allowing a user to parse through hierarchical levels of detail [VisI]. They have proved very successful in handling large amounts of data for visualization using classic approaches such bar charts, with the use of ‘levels of detail’ in regards to actual record information. Comparably it may be possible to render scatter plots as larger solid clusters, which may be recursively traversed through double clicks or other methods of selection. We intend to research the application of classic selection methods, more modern or environment specific techniques (e.g. laser beams/cones or fishing nets under immersive environments), as well as develop and test new paradigms in selection. We are confident that these visualization techniques will prove useful in analyzing the kind of multivariate data with which we are concerned here.
These labeling and selection techniques map well into other rendering methods such as parallel coordinates. Imagine a grid of interconnected (not fully connected to avoid clutter) parallel coordinates where the user can interactively pick a coordinate ‘pole’ and drag it around. As she drags the coordinate around the connection lines change to its closest neighbors. As the pole (coordinate) is dragged around it displays a special attraction (similar to grid snapping) to coordinates to which it is highly correlated. The user drops the coordinate directly on top of the second one, thus merging them. Then with a double click the coloring lookup changes to that specific coordinate, the rest of coordinates arrange themselves around the selected one, and the interconnections are rendered from the center to the outside ones.
All this is plausible, comfortably implementable under Open Inventor, and could increase the level of data understanding considerably. We will explore such interaction methodologies with the above explained visualization paradigms, as well as any other solutions we are able to envision and consider worthwhile.
Finally, we will explore other methodologies for data probing such as audio feedback. It is well know that auditory cues are processed independently from visual information by the human brain. Consequently it represents an added dimension through which information may be channeled back to the end user. Imagine that as a scientist moves her mouse over a scatter plot she hears different pitch sounds as mapped from an added dimension being mapped to the audio feedback. As a result she may be able to find, mine, high value points (perhaps outliers) or find a direct relationship among a certainn shape of the clusters she is seeing in the graph and the audio mapped field.
6.3 Interpreted Arithmetic Language
The RAVE system will be an excellent tool for visually exploring associations and features of multidimensional numerical data. Indeed, RAVE could be used to refine and adjust the collection itself. In either case, this would require the development of a RAVE which allows the user to type an arithmetic clause in terms of the available columns. The output from the module would be the event rows that satisfy the typed selection. The language used for the selection clause would be the simple internal scripting language “Shape”, which is already implemented in Iris Explorer. Alternatively, simple math operations (such as scaling or band limiting) could be implemented as separate modules, which could be chained together.
6.4 Structural Operations
Simple operations on tables include scale and bias, adjustment of bounds, and nonlinear scaling such as taking logarithms for a log plot. The result of such a computation could be either a new column, or a replacement of the existing column, in either case with appropriate metadata supplied by the module.
As noted above, there will be a picking method, or selection computationally (logic based on the value of an attribute). The result of such a selection could be to delete the rows that were selected, or to split the table into two tables. By contrast, there will be a Union module that takes two tables and makes a single table, but only if the column charactaristics (metadata) of the two match exactly. Similarly, two tables with different attributes of the same objects can be joined: but this can only happen if the set of IDs in the two tables is identical.
6.5 Other Rendering Techniques
When a record from the table is rendered, several dimensions can be shown visually. As noted above, three of the columns of the table can be used as a spatial location in the 3D visualization space. As the number of points rendered increases, interaction and display rates decrease as the graphics hardware reaches its limit capability. Furthermore, current graphic systems display all points the same size (default one pixel) regardless of their depth (distance from viewpoint), which entails that as points are added, the image quickly becomes crowded. A solution to this is the use of 3D histograms, which is done through clumping mechanisms, voxelation of the scattered data into a regular frequency grid. This reduces n points to a ixjxk grid which can be displayed using volume rendering techniques. These include the use of contouring, isosurfaces, in addition to direct volume morphing using texture based techniques [IVoR][VolP][VTK] or specialized real-time ray casting hardware [VolP]. Meanwhile other attributes may be used for colormapping. If using volume rendering one field may be used for the hue mapping as an average of the values in the voxel while intensity may be used to depict the standard deviation.
On the other hand, when dealing with a smaller set of points, perhaps a selection, or doing offline rendering (including non-interactive OpenGL, or ray tracing using a package such as POVRay [POVR][Iris]) attributes may be used for visualization being displayed as glyphs. An example of this is the use of oriented ellipsoids as done in some of the work done at Caltech by David Laidlaw [Laid].
We will exploit Iris Explorer’s fast module prototyping capabilities to allow research to tackle these visualization problems as well as nourish new techniques to be conceived and implemented. We envision and trust the potential of new paradigms to emerge from the imagination and creativity of those involved in this project.
7 Scalability
If a visualization system is to be useful as a tool, it must work effectively on the user's desktop, in addition to any high-performance visualization equipment that might be available. We have designed our system so that good work can be done with a desktop system -- assuming NAG Explorer runs on the system, meaning most Unix workstations or a good NT system. Furthermore, much larger systems can be explored in greater detail with high-performance graphics such as the Immersadesk or Cave.
The central issues are:
· how to handle large data sets which fit on a common desktop, and
· how to handle large data sets which do not fit on a common desktop.
For our intent, desktop machines are in fact limited by several factors: speed of processor, size of RAM, size of local storage, and graphic rendering capabilities. Currently, machines are increasing linearly through time in all this capabilities, so the main concern becomes whether the software scales along with it.
The RAVE system will be based on top of NAG’s Iris Explorer, a visualization system which optimally uses available memory, an allocated disk cache, and hardware rendering acceleration for its 3D graphic needs for overall maximum efficiency. Iris Explorer is a software product is constantly being improved and fine tuned to increase in performance and capabilities. Hence, as hardware improves, we can count on Iris Explorer to grow and better concurrently across all supported platforms, thus scaling RAVE along with it.
However RAVE’s scope covers beyond the desktop capabilities. Large data sets require smart parallel engines running on parallel computers in able to keep up with the needs of the science. The CACR at Caltech has cutting edge resources which will enable science to keep up with the requirements. It is RAVE’s virtue and an integral part of this proposal to be able to tap into and exploit these resources to achieve the wanted goals. As the machines grow, so will the capabilities of RAVE.
Finally, RAVE will be able to profit from other ongoing research taking place at Caltech, such as the Multiresolution Visualization Tools for the Interactive Exploration and Analysis of Large-Scale Multidimensional Experimental and Simulated Data project [Ldvi] whose purpose is to tackle large data visualization problems through data segmentation, multi-resolution mesh generation, mesh compression, and large capacity data rendering and display.
8 Resources
8.1 Databases
The PI is involved in several projects that can provide both data and eager scientific investigators who can prove the system.
The Digital Sky project is an NSF-funded venture to synthesize and federate multiple astronomical sky surveys at different wavelengths, the principle ones being DPOSS (Digital Palomar Optical Sky Survey, PI George Djorgovski) and 2MASS (2-Micron All Sky Survey), working in the optical and infrared wavebands. Each of these surveys has (or will soon have) catalogs of at least 108 celestial sources, each with several dozen numerical attributes. Other astronomical databases with whihc the PI is familiar include the Sloan Digital Sky Survey, and the Vizier catalogue of catalogues in Strasbourg, France.
The PI is strongly involved in data analysis for the NSF-funded LIGO project (Laser Interferometric Gravitational-wave Observatory), which is due to begin gathering data in 2002. This instrument is very much new territory, both from the experimental and data-analysis pojnt of view, and an environment such as this will be useful in qualitative analysis of the events revealed by the analysis software.
One of the CoIs (Bunn) is strongly involved in the CMS and
Atlas high-energy physics experiments under construction in CERN, Geneva. Data
analysis in particle physics has in the past concentrated on histograms and
scatter plots, and this extension to 3D scatter plots and parallel coordinates
may prove quite illuminating.
8.2 Software
Caltech has a site licence for Iris Explorer, which should enable early adoption of software developments such as this one, at least at Caltech. We hope to encourage more widespread adoption through further help from the NAG company.
David Rocke and Jian Dai at UC Davis are highly-cited authors of data mining software for cluster analysis and outlier detection, and they have promised the use of their knowledge and codes in collaboration with this project.
8.3 Computational Systems
The Center for Advanced Computing Research at Caltech has a number of high-performance computing and visualization platforms, including a 128-processor HP V2500, a 100-node Beowulf, and an SGI Onyx with Reality engine.
8.4 Display Systems
The Center for Advanced Computing Research at Caltech has an ImmersaDesk for 3D visualization. This is a drafting-table format virtual prototyping device. Using stereo glasses and sonic head and hand tracking, this projection-based system offers a type of virtual reality that is semi-immersive. The ImmersaDesk features a 4x5-foot rear-projected screen at a 45-degree angle. The size and position of the screen give a sufficiently wide-angle view and the ability to look down as well as forward. The resolution is 1024 x 768 at 96Hz.
9 Budget
9.1 Equipment
As platforms for the development of the RAVE system, we propose to purchase two identical high-end PC systems, one to run Linux, the other to run WindowsNT, in order to ensure cross-platform portability of the system. These machines will be equipped with dual processors running at the highest available speed, at least 512MByte of memory, substantial disk space (probably >100 GBytes in two or three devices via a RAID controller) to store useful quantities of the target scientific data. Each machine will include the latest and fastest graphics card with excellent 2D and 3D hardware acceleration. Each PC will be attached to a large monitor (>=21") capable of at least 1920x1600 resolution. Budget for each high end graphics PC including monitor: $12000.
9.2 Travel
We would like to be able to travel for workshops, conferences, and meetings with possible future collaborators. We estimate expenses for domestic travel at about $2500, so this budget provides for 3 such trips per year.
9.3 Materials and Supplies
This item ($6500 total) is mainly to cover the cost of software such as databases, drivers, web application servers, and so on.
9.4 Other Personnel
In the final year of the project, we would like to use the services of an in-house professional for documentation and preparation of open-source release of the system. This item is $7500.
10 References
[Ahlb] C. Ahlberg and E. Wistrand, “IVEE: An information Visualization and Exploration Environment. Proc. of the 1995 Visualization Conf. . Los Alamitos, CA. pp 66-77. ACM Press.
[AVS] Advanced Visual Systems. AVS5. http://www.avs.com/products/
[Beck] Barry Becker, Using MineSet for Knowledge Discovery. IEEE Computer Graphics and Applications. July/August 1997. pp 75-78. IEEE Computer Society.
[Boyd] D. Boyd, J. Gallop, J. Walton. Putting You In The Picture: Enhancing Visualization With A Virtual Environment. Hot Topics of the 1999 Visualization Conf. . San Francisco, CA, October 1999. IEEE Computer Society.
[DSTP] National Center for Data Mining at The University of Illinois at Chicago, Data Space Transfer Protocol, http://www.ncdm.uic.edu/dstp/
[Eber] David Ebert, Amen Zwa, Ethan Miller, Christopher Shaw, and Aaron Roberts Two-Handed Volumetric Document Corpus Management. IEEE Computer Graphics and Applications. July/August 1997. pp 60-62. IEEE Computer Society.
[Fua] Ying-Huey Fua, Hierarchical Parallel Coordinates. Proc. the 1999 Visualization Conf. . San Francisco, CA, October 1999. pp.43-508. IEEE Computer Society. http://davis.wpi.edu/~yingfua/cs563_1/hiervis.html
[Fyoc] Daniel Fyock, Using Visualization to Maintain Large Systems, IEEE Computer Graphics and Applications. July/August 1997. pp 73-75. IEEE Computer Society.
[Ins1] Alfredo Isenberg and B. Dimsdale Parallel Coordinates: A tool for visualizing multidimensional geometry, Proc. . IEEE 1990 Visualization Conf. p 19-25. October 1990. IEEE Computer Society.
[Ins2] Alfredo Inselberg, A. Chatterjee, et al. Parallel Visual Explorer
http://www.ibm.com/news/950203/pve-03.html
[Ins3] Alfredo Inselberg, Tova Avidan, The Automated Multidimensional Detective. Proc. 1999 IEEE Symp. Info. Visualization. San Francisco, CA. October 1999. p 112-119. IEEE Computer Society.
[Iris] Numerical Algorithms Group, Iris Explorer http://www.nag.co.uk/Welcome_IEC.html
[Kuo] Eddy Kuo, M. Lanzagorta, R. Rosenberg, S. Julier, J. Summers, C. Scannell The AVS Virtual Reality Viewer. Hot Topics of the 1999 Visualization Conf. . San Francisco, CA, October 1999. IEEE Computer Society.
[Laid] David Laidlaw, Eric T. Ahrens, David Kremers, Matthew J. Avalos, Carol Readhead, and Russell E. Jacobs, Visualizing Diffusion Tensor Images of the Mouse Spinal Cord. Proc. of the 1998 Visualization Conf. Research Triangle Park, NC. . October 1998. pp 137-134. IEEE Computer Society
[Ldvi] Multiresolution
Visualization Tools for the Interactive Exploration and Analysis of Large-Scale
Multidimensional Experimental and Simulated Data
http://www.cacr.caltech.edu/projects/ldviz/
[Odew] Odewahn, Burstein and Windhorst, Automated Morphological Galaxy Classification. Astron. J. p 114
(1997) 2219.
http://phobos.caltech.edu/~sco/sco1/research/morph_types/mt.html
[Oinv] SGI, OpenInventor 2.1, http://www.sgi.com/Technology/Inventor/
[IVoR] Ruediger Westerman and Ove Sommer, IVoR. Friedrich Alexander University of
Erlangen-Nuremberg
http://www9.informatik.uni-erlangen.de/eng/research/vis/ivor/
[Shap] Numerical Algorithms Group, Shape Scripting Language for NAG's Iris Explorer
http://www.nag.co.uk/visual/IE/iecbb/DOC/MWG/chap10.html
[Scho] Will Schroeder, Ken Martin, and Bill Lorensen, The Visualization Toolkit: An Object-Oriented Approach To 3D Graphics. Second Edition. Prentice Hall. Upper Saddle River, NJ. 1998.
[Skyv] S. Odewahn, Skyview tool, sco@astro.caltech.edu
[VisI] Visual Insights/Lucent Technologies, Advizor2000, http://www.visualinsights.com/
[VolP] RealTime Visualization, VolumePro 5000. http://www.rtviz.com/products/
[Volu] SGI, OpenGL Volumizer 1.2, http://www.sgi.com/software/volumizer/
[VTK] GE/KitWare, The Visualization Toolkit. http://www.kitware.com/vtk.html
[Ward] Matthew O. Ward and E Rundensteiner, Navigating Hierarchies with Structure-Based Brushes, Proc. . 1999 IEEE Symp. on Info. Visualization. San Francisco, CA. October 1999. p 58-63. IEEE Computer Society
[Ware] Colin Ware and Glenn Franck, Evaluating Stereo and Motion Cues for Visualizing Information Nets in Three Dimensions, ACM Transactions on Graphics. v 15 p 121-140. ACM Press.
[Xgob] Deborah F. Swayne, Di Cook, and Andreas Buja Xgobi. AT&T / Bellcore
http://www.research.att.com/areas/stat/xgobi/
[Xmdv] M. O. Ward, XmdvTool
http://davis.wpi.edu/~xmdv
[XSIL] Kent Blackburn, A. Lazzarini, T. Prince, and R. Williams, Extensible Scientific Interchange Format, http://www.cacr.caltech.edu/XSIL